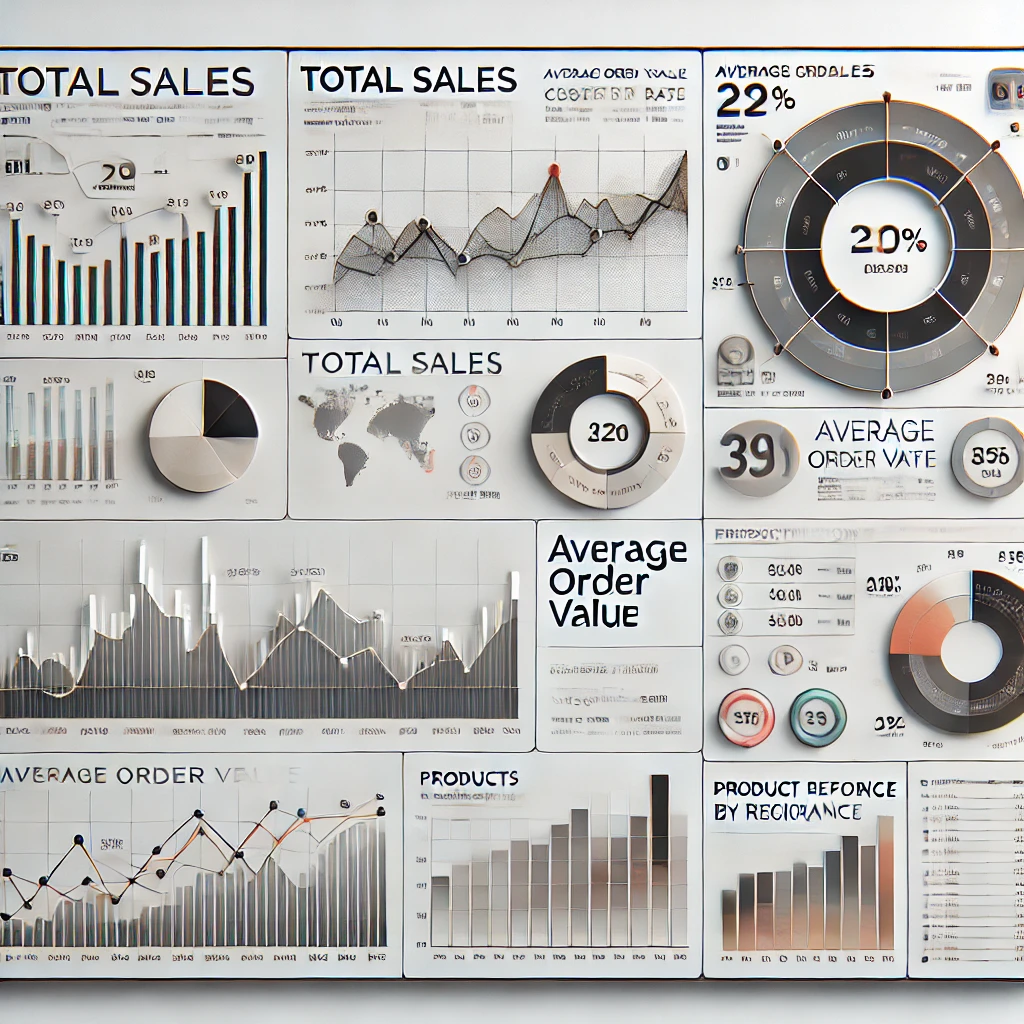
Did you know that AWS QuickSight dashboards can boost efficiency by over 50% in most organizations? Whether you’re navigating daily operations or making strategic decisions, the power of data visualization is undeniable. AWS QuickSight offers a user-friendly, scalable platform for transforming raw data into actionable insights. In this post, we’ll explore how you can maximize its potential, tackling common challenges and offering actionable tips to supercharge your dashboards
Many organizations struggle to fully leverage the capabilities of AWS QuickSight dashboards. From suboptimal configurations to inefficient workflows, the gap between raw data and meaningful insights often stems from a lack of tools or expertise. Without clear strategies, teams can find themselves stuck with static, underutilized visuals that fail to drive action.
Fortunately, with the right approach, AWS QuickSight can become a game-changer for your analytics journey. By adopting a few best practices and exploring powerful tools, you can unlock the true potential of your data.

Here are five tips to elevate your AWS QuickSight dashboards:
1. Design with the End User in Mind
Begin with clarity. Understand who will use the dashboard and what insights they need most. Tailor your visualizations to address specific business questions, avoiding clutter or irrelevant data. Consider applying interactive features like filters, drill-downs, and parameters to enhance usability for different stakeholders.
2. Leverage Advanced Features
Take full advantage of AWS QuickSight’s capabilities, such as machine learning insights for anomaly detection or forecasting. These tools add predictive power to your dashboards, helping teams anticipate trends and act proactively.
3. Optimize Performance with Data Preparation
A dashboard is only as good as the data behind it. Use AWS QuickSight’s SPICE engine to speed up queries, and ensure your datasets are clean, concise, and structured for analysis. Streamlining your ETL (Extract, Transform, Load) processes ensures faster load times and smoother user experiences.
4. Incorporate Custom Visualizations
Stand out by integrating custom visuals or third-party tools like D3.js or Plotly into your dashboards. These can complement QuickSight’s native visualizations and provide a more dynamic way to tell your data story.
5. Iterate and Improve
Dashboards should evolve with your business needs. Regularly review usage metrics and gather feedback from users to refine the design and functionality. AWS QuickSight makes it easy to update and scale dashboards as your organization grows.
